Introdução Link para o cabeçalho
Recentemente, o Hospital Albert Einstein compartilhou um conjunto de dados com observações de 5644 pacientes. Os dados possuem 111 características relacionadas a exames médicos, como sangue, urina e muito mais. A tarefa que me propus a resolver foi classificar os pacientes testados em dois grupos, aqueles que posssuem e aqueles que não possuem coronavírus. Farei isso a partir a partir dos resultados dos exames laboratoriais, sem utilizar informação alguma sobre o diagnóstico realizado em relação à contaminação do vírus.
Caso a técnica utilizada neste posto não tenha ficado muito clara, recomendo a leitura do meu post Tutorial: Como Fazer o Seu Primeiro Projeto de Data Science, que mostra com mais detalhes como ajustar o modelo random forest a um conjunto de dados.
Os dados utilizados aqui, bem como o código utilizado nesta análise, estão disponíveis em meu github.
Análise Exploratória dos Dados Link para o cabeçalho
O primeiro passo em qualquer análise de dados é a análise exploratória. É possível gerar ideias e insights apenas olhando para os dados plotados. Vou começar minha análise exploratória carregando alguns pacotes no R:
library(tidyverse)
theme_set(theme_bw())
library(naniar)
library(readxl)
library(caret)
library(reshape2)
library(GGally)
library(mice)
Com os pacotes carregados, vou ler os dados e realizar pequenas correções neles. Cada passo a seguir foi explicado com um comentário dentro do próprio código.
dataset <- read_excel(path = "data/dataset.xlsx")

# fix column names

names(dataset) <- make.names(names(dataset), unique = TRUE)

#################################
### exploratory data analysis ###
#################################

# first look at the dataset

glimpse(dataset)
## Rows: 5,644
## Columns: 111
## $ Patient.ID                                            <chr> "44477f75e8169d2…
## $ Patient.age.quantile                                  <dbl> 13, 17, 8, 5, 15…
## $ SARS.Cov.2.exam.result                                <chr> "negative", "neg…
## $ Patient.addmited.to.regular.ward..1.yes..0.no.        <dbl> 0, 0, 0, 0, 0, 0…
## $ Patient.addmited.to.semi.intensive.unit..1.yes..0.no. <dbl> 0, 0, 0, 0, 0, 0…
## $ Patient.addmited.to.intensive.care.unit..1.yes..0.no. <dbl> 0, 0, 0, 0, 0, 0…
## $ Hematocrit                                            <dbl> NA, 0.2365154, N…
## $ Hemoglobin                                            <dbl> NA, -0.02234027,…
## $ Platelets                                             <dbl> NA, -0.51741302,…
## $ Mean.platelet.volume                                  <dbl> NA, 0.01067657, …
## $ Red.blood.Cells                                       <dbl> NA, 0.1020042, N…
## $ Lymphocytes                                           <dbl> NA, 0.318365753,…
## $ Mean.corpuscular.hemoglobin.concentration..MCHC.      <dbl> NA, -0.9507903, …
## $ Leukocytes                                            <dbl> NA, -0.09461035,…
## $ Basophils                                             <dbl> NA, -0.22376651,…
## $ Mean.corpuscular.hemoglobin..MCH.                     <dbl> NA, -0.29226932,…
## $ Eosinophils                                           <dbl> NA, 1.4821582, N…
## $ Mean.corpuscular.volume..MCV.                         <dbl> NA, 0.1661924, N…
## $ Monocytes                                             <dbl> NA, 0.35754666, …
## $ Red.blood.cell.distribution.width..RDW.               <dbl> NA, -0.6250727, …
## $ Serum.Glucose                                         <dbl> NA, -0.1406481, …
## $ Respiratory.Syncytial.Virus                           <chr> NA, "not_detecte…
## $ Influenza.A                                           <chr> NA, "not_detecte…
## $ Influenza.B                                           <chr> NA, "not_detecte…
## $ Parainfluenza.1                                       <chr> NA, "not_detecte…
## $ CoronavirusNL63                                       <chr> NA, "not_detecte…
## $ Rhinovirus.Enterovirus                                <chr> NA, "detected", …
## $ Mycoplasma.pneumoniae                                 <lgl> NA, NA, NA, NA, …
## $ Coronavirus.HKU1                                      <chr> NA, "not_detecte…
## $ Parainfluenza.3                                       <chr> NA, "not_detecte…
## $ Chlamydophila.pneumoniae                              <chr> NA, "not_detecte…
## $ Adenovirus                                            <chr> NA, "not_detecte…
## $ Parainfluenza.4                                       <chr> NA, "not_detecte…
## $ Coronavirus229E                                       <chr> NA, "not_detecte…
## $ CoronavirusOC43                                       <chr> NA, "not_detecte…
## $ Inf.A.H1N1.2009                                       <chr> NA, "not_detecte…
## $ Bordetella.pertussis                                  <chr> NA, "not_detecte…
## $ Metapneumovirus                                       <chr> NA, "not_detecte…
## $ Parainfluenza.2                                       <chr> NA, "not_detecte…
## $ Neutrophils                                           <dbl> NA, -0.6190860, …
## $ Urea                                                  <dbl> NA, 1.19805908, …
## $ Proteina.C.reativa.mg.dL                              <dbl> NA, -0.1478949, …
## $ Creatinine                                            <dbl> NA, 2.0899284, N…
## $ Potassium                                             <dbl> NA, -0.3057871, …
## $ Sodium                                                <dbl> NA, 0.8625116, N…
## $ Influenza.B..rapid.test                               <chr> NA, "negative", …
## $ Influenza.A..rapid.test                               <chr> NA, "negative", …
## $ Alanine.transaminase                                  <dbl> NA, NA, NA, NA, …
## $ Aspartate.transaminase                                <dbl> NA, NA, NA, NA, …
## $ Gamma.glutamyltransferase.                            <dbl> NA, NA, NA, NA, …
## $ Total.Bilirubin                                       <dbl> NA, NA, NA, NA, …
## $ Direct.Bilirubin                                      <dbl> NA, NA, NA, NA, …
## $ Indirect.Bilirubin                                    <dbl> NA, NA, NA, NA, …
## $ Alkaline.phosphatase                                  <dbl> NA, NA, NA, NA, …
## $ Ionized.calcium.                                      <dbl> NA, NA, NA, NA, …
## $ Strepto.A                                             <chr> NA, NA, NA, NA, …
## $ Magnesium                                             <dbl> NA, NA, NA, NA, …
## $ pCO2..venous.blood.gas.analysis.                      <dbl> NA, NA, NA, NA, …
## $ Hb.saturation..venous.blood.gas.analysis.             <dbl> NA, NA, NA, NA, …
## $ Base.excess..venous.blood.gas.analysis.               <dbl> NA, NA, NA, NA, …
## $ pO2..venous.blood.gas.analysis.                       <dbl> NA, NA, NA, NA, …
## $ Fio2..venous.blood.gas.analysis.                      <lgl> NA, NA, NA, NA, …
## $ Total.CO2..venous.blood.gas.analysis.                 <dbl> NA, NA, NA, NA, …
## $ pH..venous.blood.gas.analysis.                        <dbl> NA, NA, NA, NA, …
## $ HCO3..venous.blood.gas.analysis.                      <dbl> NA, NA, NA, NA, …
## $ Rods..                                                <dbl> NA, NA, NA, NA, …
## $ Segmented                                             <dbl> NA, NA, NA, NA, …
## $ Promyelocytes                                         <dbl> NA, NA, NA, NA, …
## $ Metamyelocytes                                        <dbl> NA, NA, NA, NA, …
## $ Myelocytes                                            <dbl> NA, NA, NA, NA, …
## $ Myeloblasts                                           <dbl> NA, NA, NA, NA, …
## $ Urine...Esterase                                      <chr> NA, NA, NA, NA, …
## $ Urine...Aspect                                        <chr> NA, NA, NA, NA, …
## $ Urine...pH                                            <chr> NA, NA, NA, NA, …
## $ Urine...Hemoglobin                                    <chr> NA, NA, NA, NA, …
## $ Urine...Bile.pigments                                 <chr> NA, NA, NA, NA, …
## $ Urine...Ketone.Bodies                                 <chr> NA, NA, NA, NA, …
## $ Urine...Nitrite                                       <chr> NA, NA, NA, NA, …
## $ Urine...Density                                       <dbl> NA, NA, NA, NA, …
## $ Urine...Urobilinogen                                  <chr> NA, NA, NA, NA, …
## $ Urine...Protein                                       <chr> NA, NA, NA, NA, …
## $ Urine...Sugar                                         <lgl> NA, NA, NA, NA, …
## $ Urine...Leukocytes                                    <chr> NA, NA, NA, NA, …
## $ Urine...Crystals                                      <chr> NA, NA, NA, NA, …
## $ Urine...Red.blood.cells                               <dbl> NA, NA, NA, NA, …
## $ Urine...Hyaline.cylinders                             <chr> NA, NA, NA, NA, …
## $ Urine...Granular.cylinders                            <chr> NA, NA, NA, NA, …
## $ Urine...Yeasts                                        <chr> NA, NA, NA, NA, …
## $ Urine...Color                                         <chr> NA, NA, NA, NA, …
## $ Partial.thromboplastin.time..PTT..                    <lgl> NA, NA, NA, NA, …
## $ Relationship..Patient.Normal.                         <dbl> NA, NA, NA, NA, …
## $ International.normalized.ratio..INR.                  <dbl> NA, NA, NA, NA, …
## $ Lactic.Dehydrogenase                                  <dbl> NA, NA, NA, NA, …
## $ Prothrombin.time..PT...Activity                       <lgl> NA, NA, NA, NA, …
## $ Vitamin.B12                                           <dbl> NA, NA, NA, NA, …
## $ Creatine.phosphokinase..CPK..                         <dbl> NA, NA, NA, NA, …
## $ Ferritin                                              <dbl> NA, NA, NA, NA, …
## $ Arterial.Lactic.Acid                                  <dbl> NA, NA, NA, NA, …
## $ Lipase.dosage                                         <lgl> NA, NA, NA, NA, …
## $ D.Dimer                                               <lgl> NA, NA, NA, NA, …
## $ Albumin                                               <dbl> NA, NA, NA, NA, …
## $ Hb.saturation..arterial.blood.gases.                  <dbl> NA, NA, NA, NA, …
## $ pCO2..arterial.blood.gas.analysis.                    <dbl> NA, NA, NA, NA, …
## $ Base.excess..arterial.blood.gas.analysis.             <dbl> NA, NA, NA, NA, …
## $ pH..arterial.blood.gas.analysis.                      <dbl> NA, NA, NA, NA, …
## $ Total.CO2..arterial.blood.gas.analysis.               <dbl> NA, NA, NA, NA, …
## $ HCO3..arterial.blood.gas.analysis.                    <dbl> NA, NA, NA, NA, …
## $ pO2..arterial.blood.gas.analysis.                     <dbl> NA, NA, NA, NA, …
## $ Arteiral.Fio2                                         <dbl> NA, NA, NA, NA, …
## $ Phosphor                                              <dbl> NA, NA, NA, NA, …
## $ ctO2..arterial.blood.gas.analysis.                    <dbl> NA, NA, NA, NA, …
# remove columns that won't help on diagnosis

dataset_clean <- dataset %>%
  select(-Patient.ID,
         -Patient.addmited.to.regular.ward..1.yes..0.no.,
         -Patient.addmited.to.semi.intensive.unit..1.yes..0.no.,
         -Patient.addmited.to.intensive.care.unit..1.yes..0.no.)

# convert level Urine...Leukocytes <1000 to 1000

dataset_clean$Urine...Leukocytes[dataset_clean$`Urine...Leukocytes` == "<1000"] <- 1000
dataset_clean$`Urine...Leukocytes` <- as.numeric(dataset_clean$`Urine...Leukocytes`)

# fix Urine...pH

dataset_clean$`Urine...pH`[dataset_clean$`Urine...pH` == "Não Realizado"] <- NA
dataset_clean$`Urine...pH` <- as.numeric(dataset_clean$`Urine...pH`)

# Urine...Hemoglobin

dataset_clean$`Urine...Hemoglobin`[dataset_clean$`Urine...Hemoglobin` == "not_done"] <- NA

# Urine...Aspect

dataset_clean$`Urine...Aspect` <- factor(dataset_clean$`Urine...Aspect`,
                                         levels = c("clear", "lightly_cloudy", "cloudy", "altered_coloring"))

# Strepto A

dataset_clean$`Strepto.A`[dataset_clean$`Strepto.A` == "not_done"] <- NA

# transform character to factor

dataset_clean_num <- dataset_clean %>%
  select_if(is.numeric)

dataset_clean_cat <- dataset_clean %>%
  select_if(negate(is.numeric)) %>%
  mutate_all(as.factor)

dataset_clean <- base::cbind(dataset_clean_num, dataset_clean_cat)

# fix factor levels

# sort(sapply(dataset_clean[,sapply(dataset_clean, is.factor)], nlevels))
Com os dados lidos e processados, eu dou uma olhada nos dados faltantes:
# let's take a look on missing data

missing_values <- dataset_clean %>%
  gather(key = "key", value = "val") %>%
  mutate(is.missing = is.na(val)) %>%
  group_by(key, is.missing) %>%
  summarise(num.missing = n()) %>%
  filter(is.missing == TRUE) %>%
  select(-is.missing) %>%
  ungroup() %>%
  mutate(key = reorder(key, -num.missing)) %>%
  arrange(desc(num.missing)) %>%
  print(n = Inf)
## Warning: attributes are not identical across measure variables; they will be
## dropped
## `summarise()` has grouped output by 'key'. You can override using the `.groups`
## argument.
## # A tibble: 105 × 2
##     key                                              num.missing
##     <fct>                                                  <int>
##   1 D.Dimer                                                 5644
##   2 Mycoplasma.pneumoniae                                   5644
##   3 Partial.thromboplastin.time..PTT..                      5644
##   4 Prothrombin.time..PT...Activity                         5644
##   5 Urine...Sugar                                           5644
##   6 Fio2..venous.blood.gas.analysis.                        5643
##   7 Urine...Nitrite                                         5643
##   8 Vitamin.B12                                             5641
##   9 Lipase.dosage                                           5636
##  10 Albumin                                                 5631
##  11 Arteiral.Fio2                                           5624
##  12 Phosphor                                                5624
##  13 Ferritin                                                5621
##  14 Arterial.Lactic.Acid                                    5617
##  15 Base.excess..arterial.blood.gas.analysis.               5617
##  16 HCO3..arterial.blood.gas.analysis.                      5617
##  17 Hb.saturation..arterial.blood.gases.                    5617
##  18 Total.CO2..arterial.blood.gas.analysis.                 5617
##  19 ctO2..arterial.blood.gas.analysis.                      5617
##  20 pCO2..arterial.blood.gas.analysis.                      5617
##  21 pH..arterial.blood.gas.analysis.                        5617
##  22 pO2..arterial.blood.gas.analysis.                       5617
##  23 Magnesium                                               5604
##  24 Ionized.calcium.                                        5594
##  25 Urine...Ketone.Bodies                                   5587
##  26 Urine...Esterase                                        5584
##  27 Urine...Protein                                         5584
##  28 Urine...Hyaline.cylinders                               5577
##  29 Urine...Granular.cylinders                              5575
##  30 Urine...Hemoglobin                                      5575
##  31 Urine...Urobilinogen                                    5575
##  32 Urine...pH                                              5575
##  33 Urine...Aspect                                          5574
##  34 Urine...Bile.pigments                                   5574
##  35 Urine...Color                                           5574
##  36 Urine...Crystals                                        5574
##  37 Urine...Density                                         5574
##  38 Urine...Leukocytes                                      5574
##  39 Urine...Red.blood.cells                                 5574
##  40 Urine...Yeasts                                          5574
##  41 Relationship..Patient.Normal.                           5553
##  42 Metamyelocytes                                          5547
##  43 Myeloblasts                                             5547
##  44 Myelocytes                                              5547
##  45 Promyelocytes                                           5547
##  46 Rods..                                                  5547
##  47 Segmented                                               5547
##  48 Lactic.Dehydrogenase                                    5543
##  49 Creatine.phosphokinase..CPK..                           5540
##  50 International.normalized.ratio..INR.                    5511
##  51 Base.excess..venous.blood.gas.analysis.                 5508
##  52 HCO3..venous.blood.gas.analysis.                        5508
##  53 Hb.saturation..venous.blood.gas.analysis.               5508
##  54 Total.CO2..venous.blood.gas.analysis.                   5508
##  55 pCO2..venous.blood.gas.analysis.                        5508
##  56 pH..venous.blood.gas.analysis.                          5508
##  57 pO2..venous.blood.gas.analysis.                         5508
##  58 Alkaline.phosphatase                                    5500
##  59 Gamma.glutamyltransferase.                              5491
##  60 Direct.Bilirubin                                        5462
##  61 Indirect.Bilirubin                                      5462
##  62 Total.Bilirubin                                         5462
##  63 Serum.Glucose                                           5436
##  64 Alanine.transaminase                                    5419
##  65 Aspartate.transaminase                                  5418
##  66 Strepto.A                                               5313
##  67 Sodium                                                  5274
##  68 Potassium                                               5273
##  69 Urea                                                    5247
##  70 Creatinine                                              5220
##  71 Proteina.C.reativa.mg.dL                                5138
##  72 Neutrophils                                             5131
##  73 Mean.platelet.volume                                    5045
##  74 Monocytes                                               5043
##  75 Basophils                                               5042
##  76 Eosinophils                                             5042
##  77 Leukocytes                                              5042
##  78 Lymphocytes                                             5042
##  79 Mean.corpuscular.hemoglobin..MCH.                       5042
##  80 Mean.corpuscular.hemoglobin.concentration..MCHC.        5042
##  81 Mean.corpuscular.volume..MCV.                           5042
##  82 Platelets                                               5042
##  83 Red.blood.Cells                                         5042
##  84 Red.blood.cell.distribution.width..RDW.                 5042
##  85 Hematocrit                                              5041
##  86 Hemoglobin                                              5041
##  87 Influenza.A..rapid.test                                 4824
##  88 Influenza.B..rapid.test                                 4824
##  89 Adenovirus                                              4292
##  90 Bordetella.pertussis                                    4292
##  91 Chlamydophila.pneumoniae                                4292
##  92 Coronavirus.HKU1                                        4292
##  93 Coronavirus229E                                         4292
##  94 CoronavirusNL63                                         4292
##  95 CoronavirusOC43                                         4292
##  96 Inf.A.H1N1.2009                                         4292
##  97 Metapneumovirus                                         4292
##  98 Parainfluenza.1                                         4292
##  99 Parainfluenza.2                                         4292
## 100 Parainfluenza.3                                         4292
## 101 Parainfluenza.4                                         4292
## 102 Rhinovirus.Enterovirus                                  4292
## 103 Influenza.A                                             4290
## 104 Influenza.B                                             4290
## 105 Respiratory.Syncytial.Virus                             4290
missing_values %>%
  ggplot() +
  geom_bar(aes(x = key, y = 100*num.missing/dim(dataset_clean)[1]), stat = "identity") +
  labs(x = "Variable", y="Percent of missing values") +
  theme(axis.text.x = element_text(angle = 45, hjust = 1, size = 8))
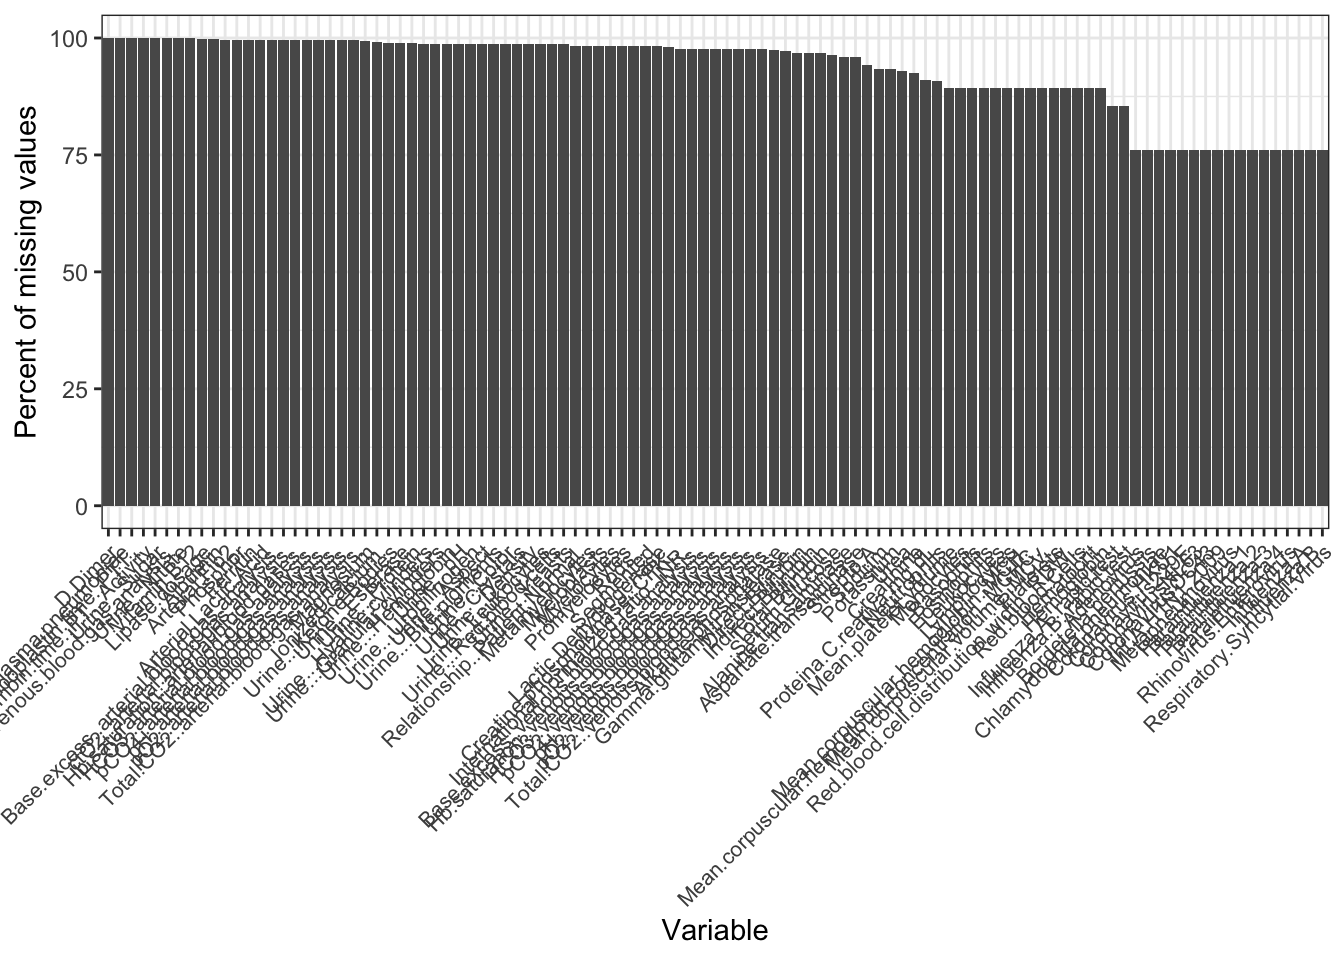
Este gráfico mostra quais são as variáveis com maior quantidade de dados faltantes. Note que algumas delas possuem quase 100% de dados faltantes! Veja o gráfico a seguir para que tenhamos uma ideia melhor da magnitude da falta de dados que estamos enfrentando:
vis_miss(dataset_clean) +
  theme(axis.text.x = element_text(size = 6))
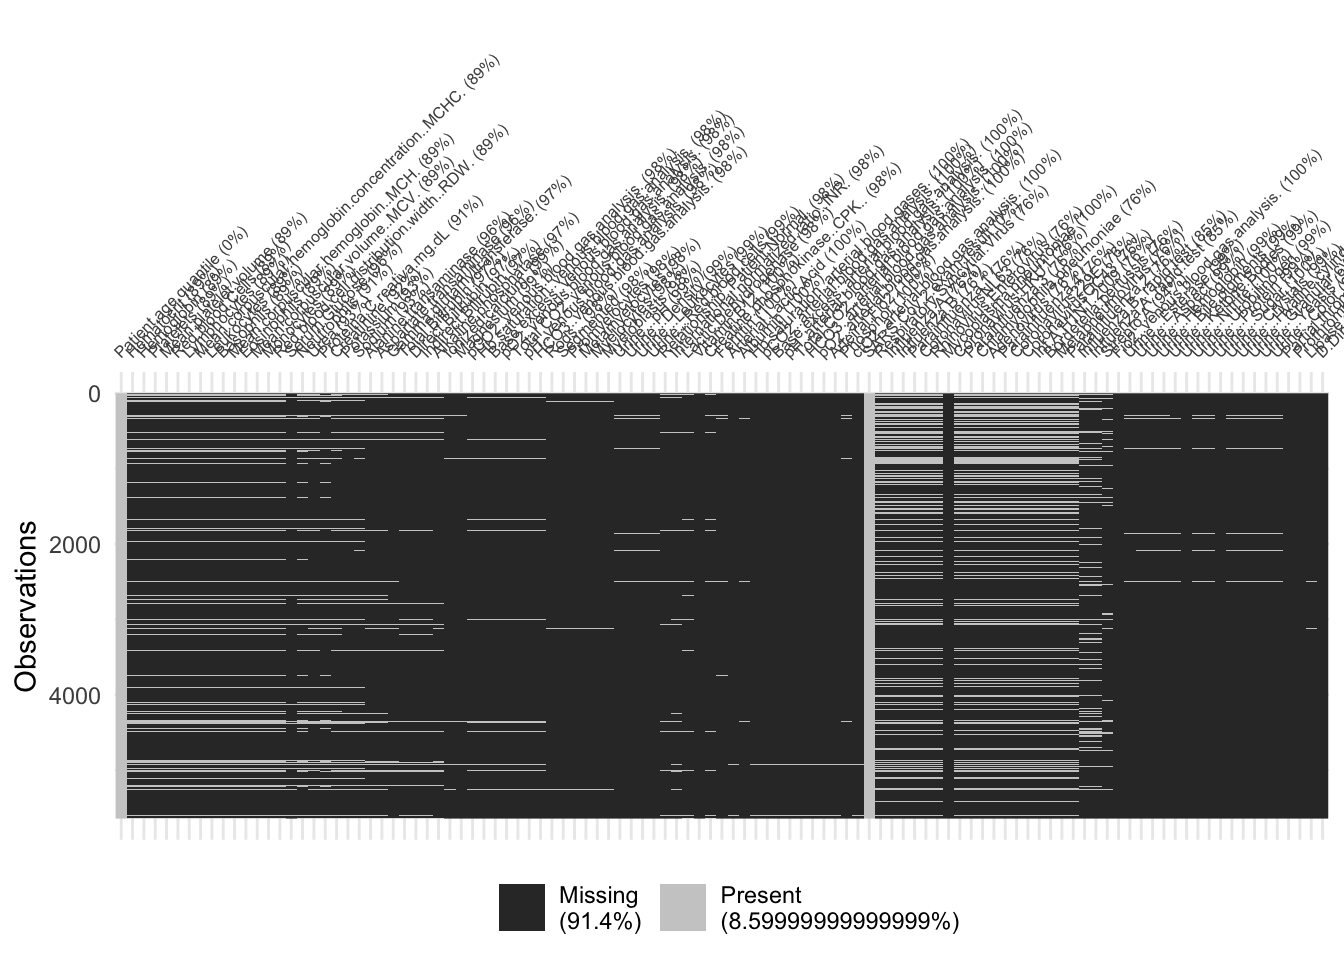
Mais de 91% de dados faltantes é muita coisa. Este tipo de informação não me dá muita esperança em encontrar um modelo bom para estes dados. Mesmo assim, vou tentar algo e ver o que acontece. Para isso, vou manter no conjunto a ser analisado apenas as colunas com pelo menos 1000 observações. Ou seja, vou retirar todas as colunas com muito poucos dados registrados.
# keep only columns with at least n observations

n <- 1000

dataset_clean <- dataset_clean[, which(dim(dataset_clean)[1] - apply(apply(dataset_clean, 2, is.na), 2, sum) >= n)]

# remove quantitative variables with variance equal to zero

dataset_model_num <- dataset_clean %>%
  select_if(is.numeric)

if (sum(apply(dataset_model_num, 2, var, na.rm = TRUE) == 0) != 0) {
  dataset_model_num <- dataset_model_num[, which(apply(dataset_model_num, 2, var, na.rm = TRUE) == 0)]
}

# remove categorical variables with only one level

dataset_model_cat <- dataset_clean %>%
  select_if(negate(is.numeric))

dataset_model_cat <- dataset_model_cat[, sapply(dataset_model_cat, nlevels) > 1]

# final dataset

dataset_model <- base::cbind(dataset_model_num, dataset_model_cat)

vis_miss(dataset_model) + # it needs naniar package
  theme(axis.text.x = element_text(size = 6))
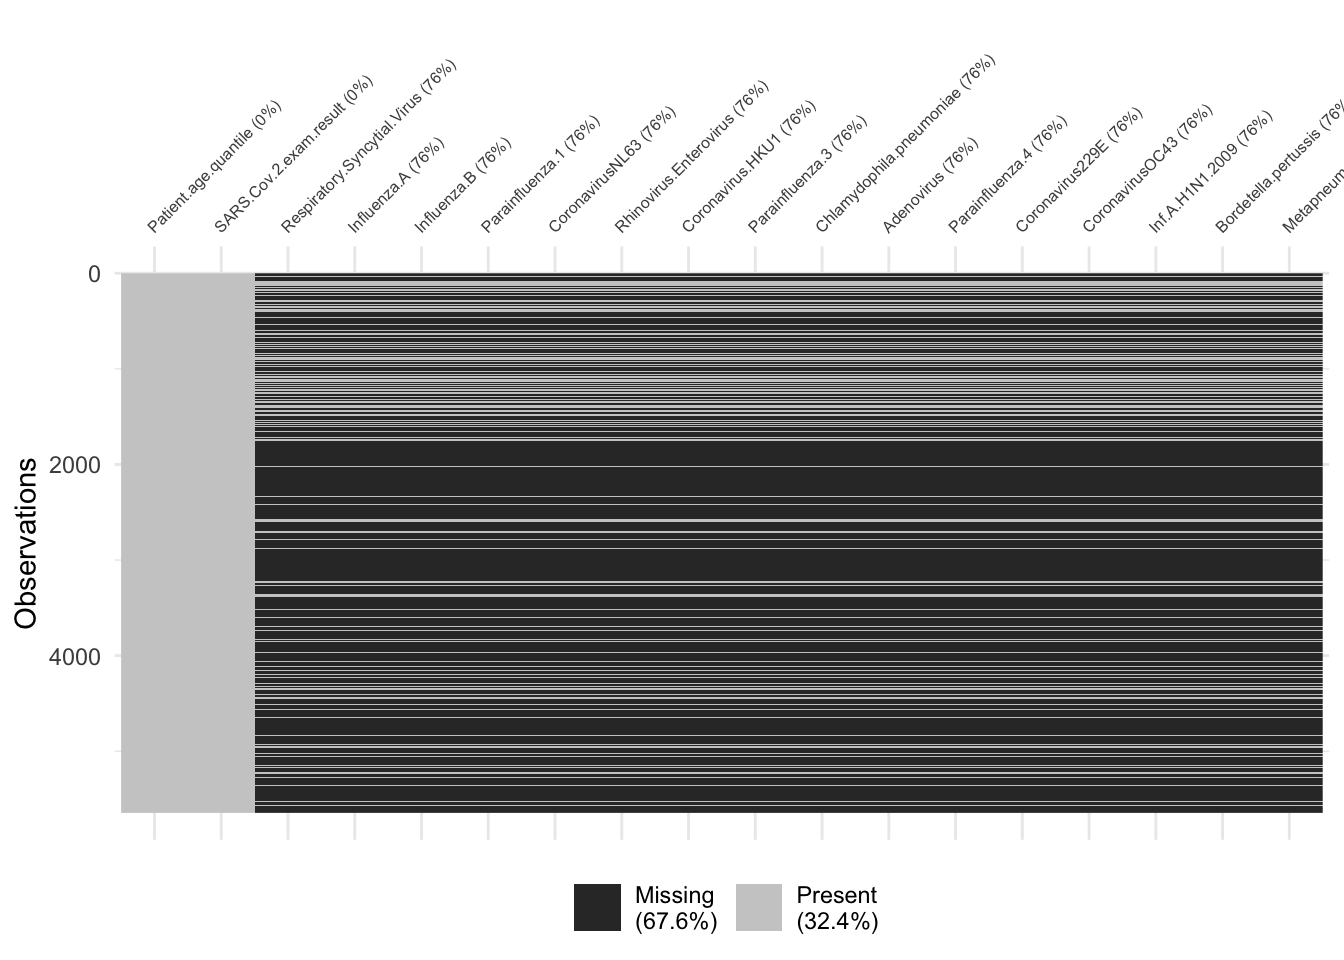
É possíver ver que há uma proporção menor de dados faltantes neste conjunto processado. Baixamos a proporção de dados faltantes de 91,4% para 68%. Ainda é um valor bastante alto, mas está um pouco menos pior do que o original.
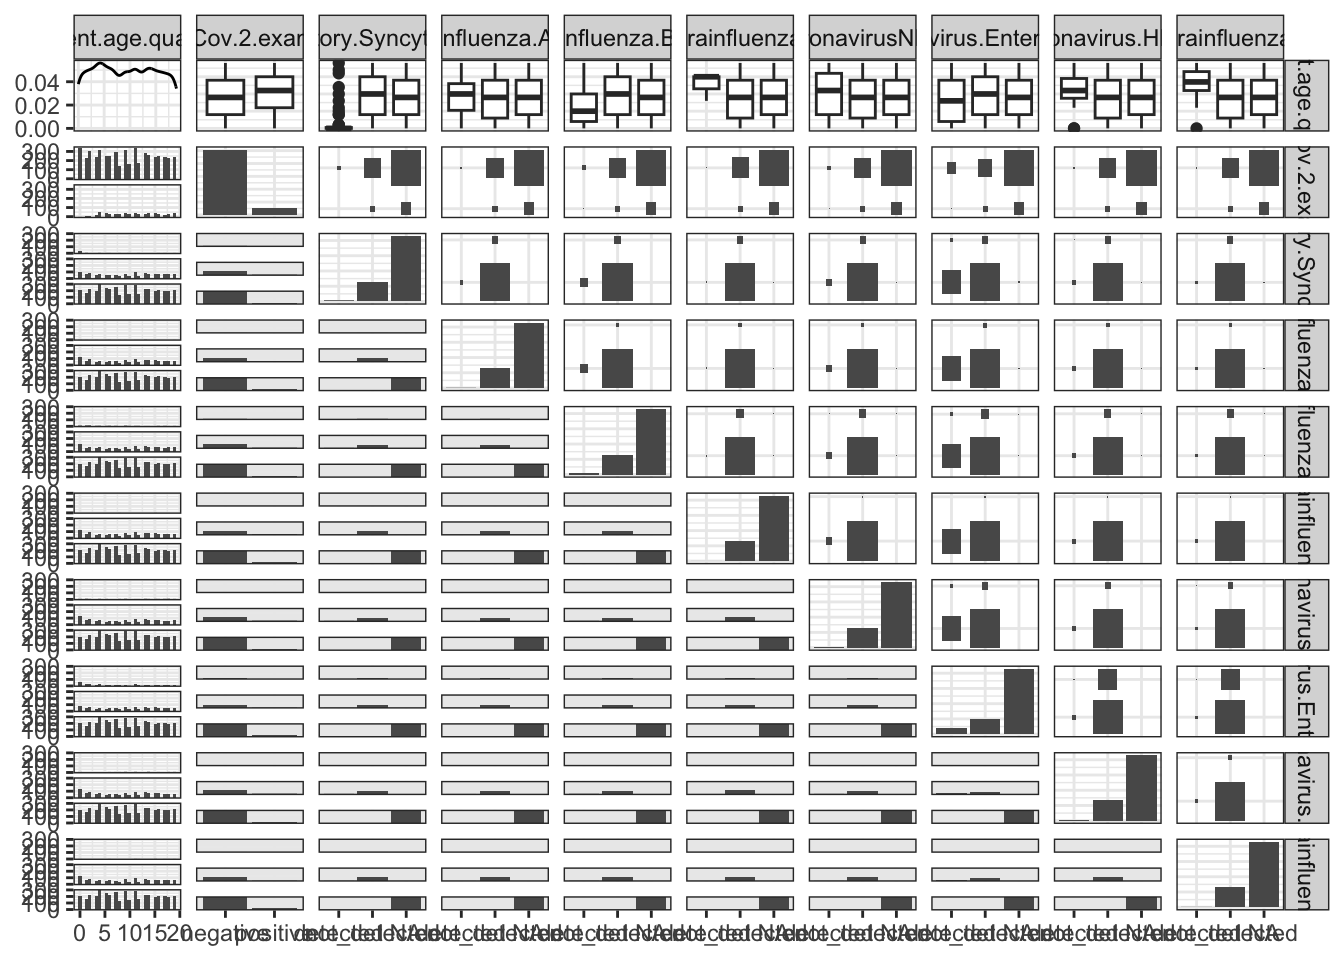
Abaixo coloco mais alguns gráficos que tentam relacionar as variáveis que restaram no conjunto de dados, mas aparentemente não há relação alguma entre elas.
# some other plots

ggpairs(dataset_model[, c(1:10)])
## `stat_bin()` using `bins = 30`. Pick better value with `binwidth`.
## `stat_bin()` using `bins = 30`. Pick better value with `binwidth`.
## Warning: Removed 4290 rows containing non-finite outside the scale range
## (`stat_g_gally_count()`).
## Removed 4290 rows containing non-finite outside the scale range
## (`stat_g_gally_count()`).
## Removed 4290 rows containing non-finite outside the scale range
## (`stat_g_gally_count()`).
## Removed 4290 rows containing non-finite outside the scale range
## (`stat_g_gally_count()`).
## Removed 4290 rows containing non-finite outside the scale range
## (`stat_g_gally_count()`).
## Removed 4290 rows containing non-finite outside the scale range
## (`stat_g_gally_count()`).
## Removed 4290 rows containing non-finite outside the scale range
## (`stat_g_gally_count()`).
## `stat_bin()` using `bins = 30`. Pick better value with `binwidth`.
## Warning: Removed 4290 rows containing non-finite outside the scale range
## (`stat_g_gally_count()`).
## Removed 4290 rows containing non-finite outside the scale range
## (`stat_g_gally_count()`).
## Removed 4290 rows containing non-finite outside the scale range
## (`stat_g_gally_count()`).
## Removed 4290 rows containing non-finite outside the scale range
## (`stat_g_gally_count()`).
## Removed 4290 rows containing non-finite outside the scale range
## (`stat_g_gally_count()`).
## Removed 4290 rows containing non-finite outside the scale range
## (`stat_g_gally_count()`).
## `stat_bin()` using `bins = 30`. Pick better value with `binwidth`.
## Warning: Removed 4290 rows containing non-finite outside the scale range
## (`stat_g_gally_count()`).
## Removed 4290 rows containing non-finite outside the scale range
## (`stat_g_gally_count()`).
## Removed 4290 rows containing non-finite outside the scale range
## (`stat_g_gally_count()`).
## Removed 4290 rows containing non-finite outside the scale range
## (`stat_g_gally_count()`).
## Removed 4290 rows containing non-finite outside the scale range
## (`stat_g_gally_count()`).
## `stat_bin()` using `bins = 30`. Pick better value with `binwidth`.
## Warning: Removed 4292 rows containing non-finite outside the scale range
## (`stat_g_gally_count()`).
## Warning: Removed 4292 rows containing non-finite outside the scale range
## (`stat_g_gally_count()`).
## Removed 4292 rows containing non-finite outside the scale range
## (`stat_g_gally_count()`).
## Removed 4292 rows containing non-finite outside the scale range
## (`stat_g_gally_count()`).
## `stat_bin()` using `bins = 30`. Pick better value with `binwidth`.
## Warning: Removed 4292 rows containing non-finite outside the scale range
## (`stat_g_gally_count()`).
## Removed 4292 rows containing non-finite outside the scale range
## (`stat_g_gally_count()`).
## Removed 4292 rows containing non-finite outside the scale range
## (`stat_g_gally_count()`).
## `stat_bin()` using `bins = 30`. Pick better value with `binwidth`.
## Warning: Removed 4292 rows containing non-finite outside the scale range
## (`stat_g_gally_count()`).
## Removed 4292 rows containing non-finite outside the scale range
## (`stat_g_gally_count()`).
## `stat_bin()` using `bins = 30`. Pick better value with `binwidth`.
## Warning: Removed 4292 rows containing non-finite outside the scale range
## (`stat_g_gally_count()`).
## `stat_bin()` using `bins = 30`. Pick better value with `binwidth`.
ggpairs(dataset_model[, c(11:ncol(dataset_model))])
## Warning: Removed 4292 rows containing non-finite outside the scale range
## (`stat_g_gally_count()`).
## Removed 4292 rows containing non-finite outside the scale range
## (`stat_g_gally_count()`).
## Removed 4292 rows containing non-finite outside the scale range
## (`stat_g_gally_count()`).
## Removed 4292 rows containing non-finite outside the scale range
## (`stat_g_gally_count()`).
## Removed 4292 rows containing non-finite outside the scale range
## (`stat_g_gally_count()`).
## Removed 4292 rows containing non-finite outside the scale range
## (`stat_g_gally_count()`).
## Removed 4292 rows containing non-finite outside the scale range
## (`stat_g_gally_count()`).
## Removed 4292 rows containing non-finite outside the scale range
## (`stat_g_gally_count()`).
## Removed 4292 rows containing non-finite outside the scale range
## (`stat_g_gally_count()`).
## Removed 4292 rows containing non-finite outside the scale range
## (`stat_g_gally_count()`).
## Removed 4292 rows containing non-finite outside the scale range
## (`stat_g_gally_count()`).
## Removed 4292 rows containing non-finite outside the scale range
## (`stat_g_gally_count()`).
## Removed 4292 rows containing non-finite outside the scale range
## (`stat_g_gally_count()`).
## Removed 4292 rows containing non-finite outside the scale range
## (`stat_g_gally_count()`).
## Removed 4292 rows containing non-finite outside the scale range
## (`stat_g_gally_count()`).
## Removed 4292 rows containing non-finite outside the scale range
## (`stat_g_gally_count()`).
## Removed 4292 rows containing non-finite outside the scale range
## (`stat_g_gally_count()`).
## Removed 4292 rows containing non-finite outside the scale range
## (`stat_g_gally_count()`).
## Removed 4292 rows containing non-finite outside the scale range
## (`stat_g_gally_count()`).
## Removed 4292 rows containing non-finite outside the scale range
## (`stat_g_gally_count()`).
## Removed 4292 rows containing non-finite outside the scale range
## (`stat_g_gally_count()`).
## Removed 4292 rows containing non-finite outside the scale range
## (`stat_g_gally_count()`).
## Removed 4292 rows containing non-finite outside the scale range
## (`stat_g_gally_count()`).
## Removed 4292 rows containing non-finite outside the scale range
## (`stat_g_gally_count()`).
## Removed 4292 rows containing non-finite outside the scale range
## (`stat_g_gally_count()`).
## Removed 4292 rows containing non-finite outside the scale range
## (`stat_g_gally_count()`).
## Removed 4292 rows containing non-finite outside the scale range
## (`stat_g_gally_count()`).
## Removed 4292 rows containing non-finite outside the scale range
## (`stat_g_gally_count()`).
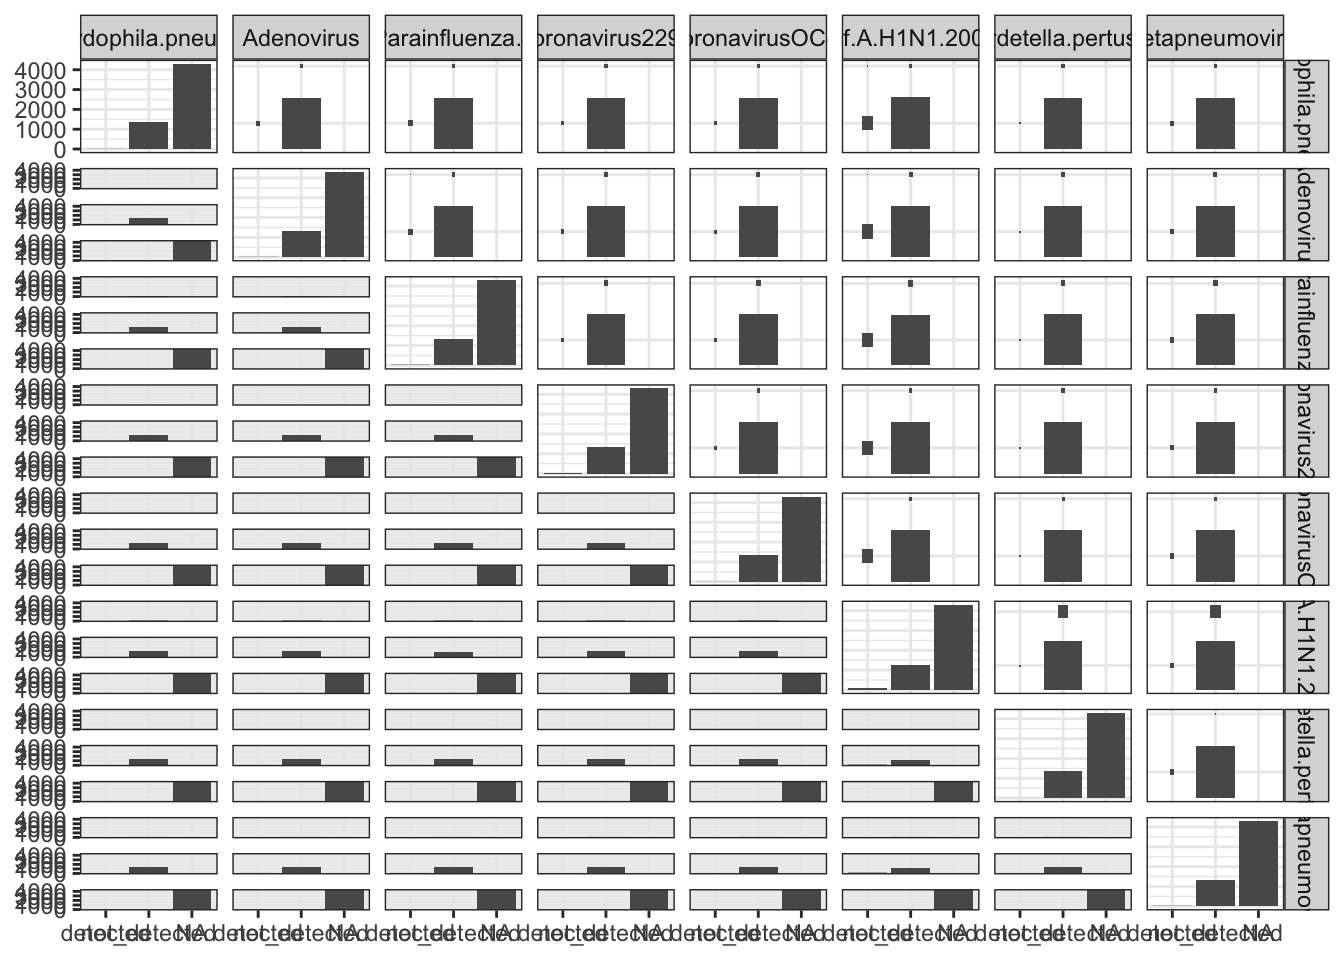
# it seems there is no relation between any pair of variables
Modelagem 1 Link para o cabeçalho
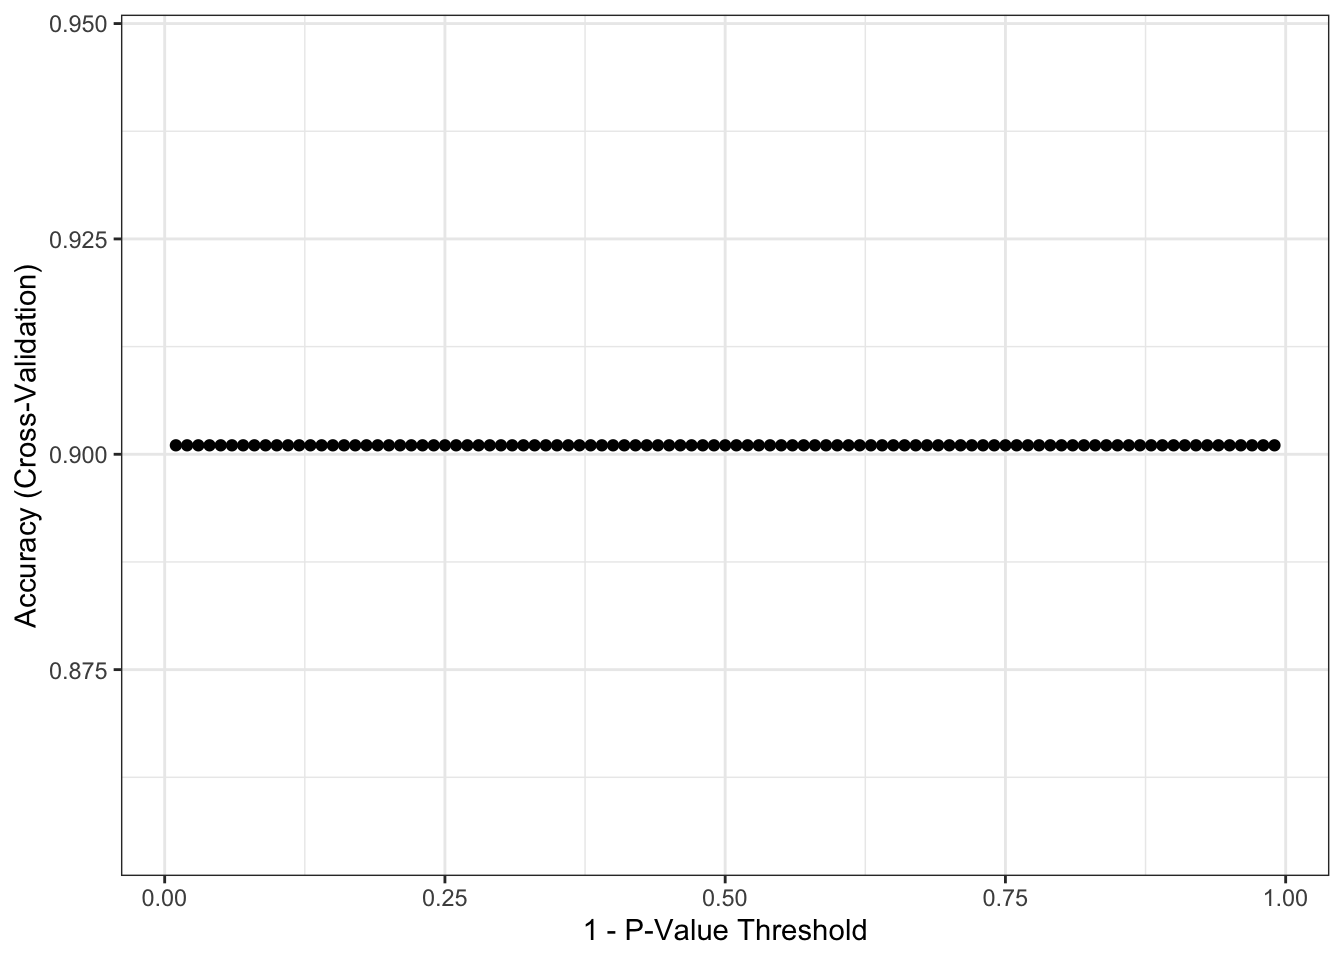
Poucos modelos de aprendizagem de máquina conseguem lidar com dados faltantes. Por este motivo, decidi escolher um modelo chamado CART (Classification and Regression Tree - Árvore de Classificação e Regressão). Abaixo estão os resultados obtidos, após a separação do conjunto de dados original em treinamento e teste. Os resultados reportados foram obtidos após a aplicação do modelo ajustado no conjunto de teste. Para saber mais porque fazer isso, recomendo novamente meu post Tutorial: Como Fazer o Seu Primeiro Projeto de Data Science.
################
### modeling ###
################

# train/test split

covid <- dataset_model

set.seed(1)

index       <- createDataPartition(covid$SARS.Cov.2.exam.result,
                                   p = 0.75,
                                   list = FALSE)
covid_train <- covid[ index, ]
covid_test  <- covid[-index, ]

dim(covid_train)
table(covid_train$SARS.Cov.2.exam.result)

dim(covid_test)
table(covid_test$SARS.Cov.2.exam.result)

# parameters for cart

fitControl <- trainControl(method = "cv",
                           number = 5,
                           savePred = TRUE,
                           classProb = TRUE)

tune.grid <- expand.grid(mincriterion = seq(from = 0.01,
                                            to = .99,
                                            by = 0.01))

set.seed(1)

x <- covid_train %>%
  select(-SARS.Cov.2.exam.result)

y <- covid_train %>%
  select(SARS.Cov.2.exam.result) %>%
  unlist()

covid_ctree <- train(x, y,
                     method = "ctree",
                     tuneGrid = tune.grid,
                     trControl = fitControl)
ggplot(covid_ctree)
prediction <- predict(covid_ctree, covid_test)

confusionMatrix(prediction, covid_test$SARS.Cov.2.exam.result)
## Confusion Matrix and Statistics
##
##           Reference
## Prediction negative positive
##   negative     1271      139
##   positive        0        0
##
##                Accuracy : 0.9014
##                  95% CI : (0.8847, 0.9165)
##     No Information Rate : 0.9014
##     P-Value [Acc > NIR] : 0.5226
##
##                   Kappa : 0
##
##  Mcnemar's Test P-Value : <2e-16
##
##             Sensitivity : 1.0000
##             Specificity : 0.0000
##          Pos Pred Value : 0.9014
##          Neg Pred Value :    NaN
##              Prevalence : 0.9014
##          Detection Rate : 0.9014
##    Detection Prevalence : 1.0000
##       Balanced Accuracy : 0.5000
##
##        'Positive' Class : negative
##
# 90% accuracy seems good, but No Information Rate is also 90%
# so, using this model or a random process gives the same answer
# high sensitivity, but very low specificity :(
Note que obtive 90% de acurácia no meu modelo. Ou seja, ele acerta 90% das tentativas de classificar um paciente como positivo ou negativo em relação ao coronavírus. Parece um resultado muito bom, mas não é. Ele é péssimo, na realidade.
No conjunto de dados original, aproximadamente 90% dos pacientes não possuem coronavírus, enquanto 10% estão infectados. O meu modelo encontra, com 100% de certeza, quem não tem coronavírus (é o valor de Sensitivity no output acima). Entretanto, encontra 0% dos pacientes com coronavírus (é o valor de Specificity no output acima). Ou seja, ele vai mandar para casa todo mundo que chegar no hospital, tendo coronavírus ou não.
Isso me fez partir para uma segunda modelagem.
Modelagem 2 Link para o cabeçalho
Vimos que a primeira modelagem não deu bons resultados. Com o intuito de tentar obter resultados melhores, vou proceder com a imputação de dados. Se for tentar rodar o código abaixo em seu computador, prepare-se para esperar uns bons minutos.
#######################
### data imputation ###
#######################

covid_imp <- mice(covid, meth = "rf", ntree = 5) # be patient

covid <- complete(covid_imp)
################
### modeling ###
################

# train/test split

set.seed(1)

index       <- createDataPartition(covid$SARS.Cov.2.exam.result,
                                   p = 0.75,
                                   list = FALSE)
covid_train <- covid[ index, ]
covid_test  <- covid[-index, ]

dim(covid_train)
table(covid_train$SARS.Cov.2.exam.result)

dim(covid_test)
table(covid_test$SARS.Cov.2.exam.result)

# parameters for random forest

fitControl <- trainControl(method = "cv",
                           number = 5,
                           savePred = TRUE,
                           classProb = TRUE)

tune.grid <- expand.grid(mtry = 1:35)

set.seed(1)

x <- covid_train %>%
  select(-SARS.Cov.2.exam.result)

y <- covid_train %>%
  select(SARS.Cov.2.exam.result) %>%
  unlist()

covid_rf <- train(x, y,
                  method = "rf",
                  tuneGrid = tune.grid,
                  trControl = fitControl)
ggplot(covid_rf)
prediction <- predict(covid_rf, covid_test)

confusionMatrix(prediction, covid_test$SARS.Cov.2.exam.result)
## Confusion Matrix and Statistics
##
##           Reference
## Prediction negative positive
##   negative     1271      139
##   positive        0        0
##
##                Accuracy : 0.9014
##                  95% CI : (0.8847, 0.9165)
##     No Information Rate : 0.9014
##     P-Value [Acc > NIR] : 0.5226
##
##                   Kappa : 0
##
##  Mcnemar's Test P-Value : <2e-16
##
##             Sensitivity : 1.0000
##             Specificity : 0.0000
##          Pos Pred Value : 0.9014
##          Neg Pred Value :    NaN
##              Prevalence : 0.9014
##          Detection Rate : 0.9014
##    Detection Prevalence : 1.0000
##       Balanced Accuracy : 0.5000
##
##        'Positive' Class : negative
##
# high sensitivity, but very low specificity :(
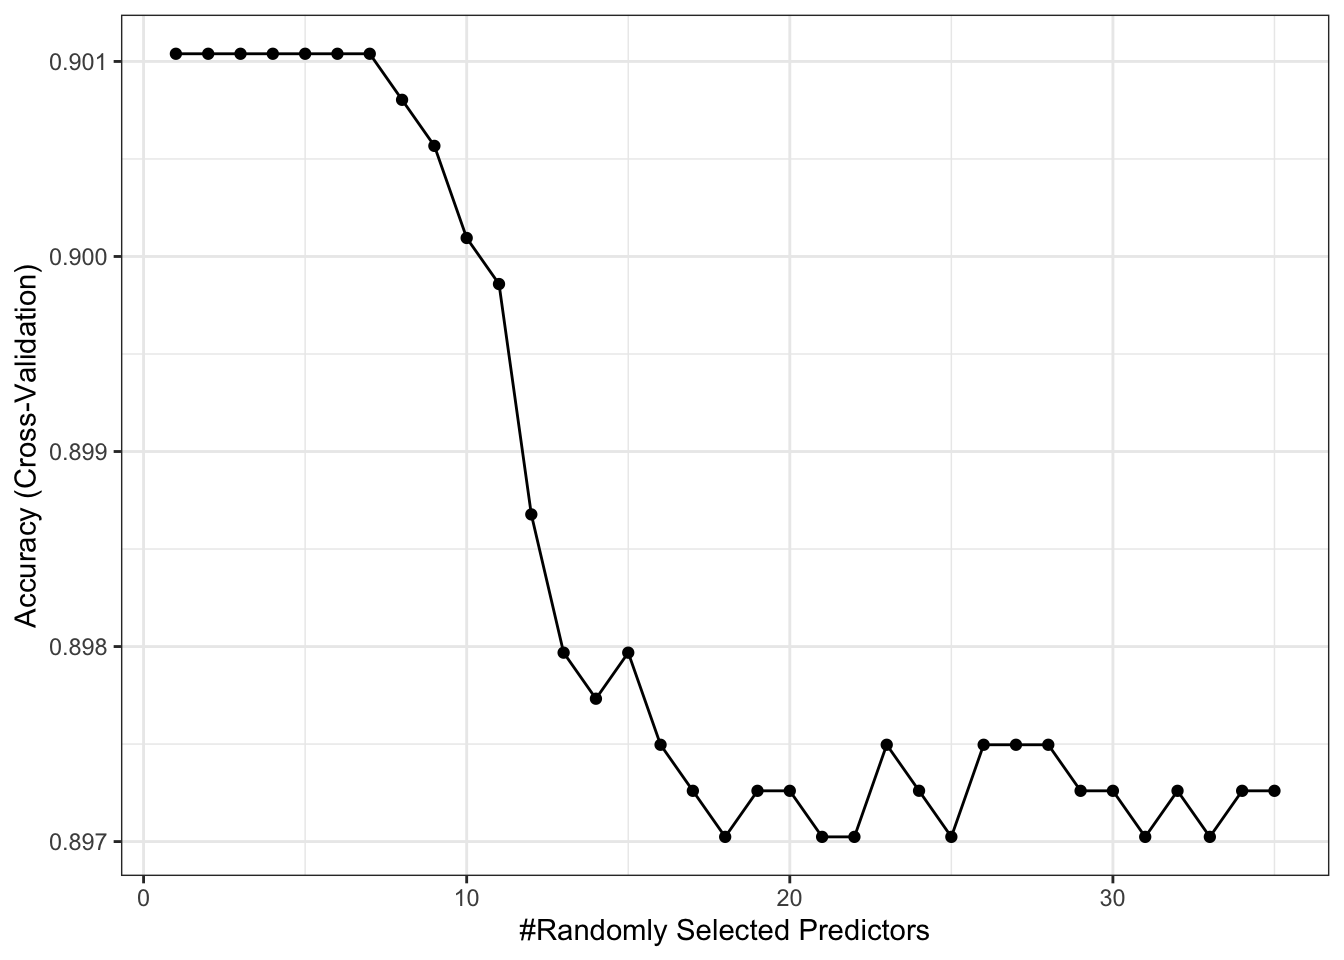
De novo, o mesmo problema: alta sensitividade e baixíssima especificidade neste modelo. Ou seja, não é melhor do que o modelo anterior ou uma seleção aleatória de diagnóstico.
Conclusão Link para o cabeçalho
Eu cheguei no meu modelo final. 90% de acurácia usando random forest. Mas como a variável resposta é desbalanceada, com 90% para uma classe e 10% para outra, este meu modelo não serve pra nada.
Mesmo tentando abordagens diversas, como filtragem de dados faltantes e imputação, nada deu certo pra mim. Aparentemente este é um resultado geral para este problema. Os outros participantes deste desafio no kaggle criaram várias análises diferentes, com muitas abordagens interessantes, mas ninguém consegue uma boa detecção de verdadeiros positivos.
Tenho pouca esperança que, com este conjunto de dados específico, seja possível fazer algo preditivo de qualidade. Talvez com uma feature engineering muito boa? Pode ser, mas não podemos esquecer que são muitos dados faltantes. No conjunto original, sem pré-processamento, são 91% de dados faltantes. Não dá pra fazer milagre.
Como sempre, o código utilizado nesta análise está disponível em meu github.